
q3d modified titration plan compared with the q7d trial plan

nkresho

Explorer
Joined
May 20, 2026
Messages
38
Reaction score
0
Location
Pennsylvania
Spent some time in excel today, thought the group might get something out of it.

I've been digging into half-life a little and putting the trial dosing timeline side by side with a tighter interval (the one I'm on).

Results below.

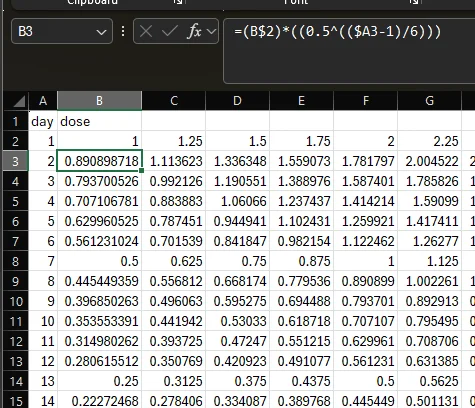
Step one was building an excel formula for the 6 day half life decay.

saturation from the previous day times 0.5 raised to (days elapsed / 6)

With that, day 6 lands at half, day 12 at a quarter, and it keeps halving from there...


df8fef69dacd78543278b02263647734fbe8daa76806999957b3a62cba162dc3.webp


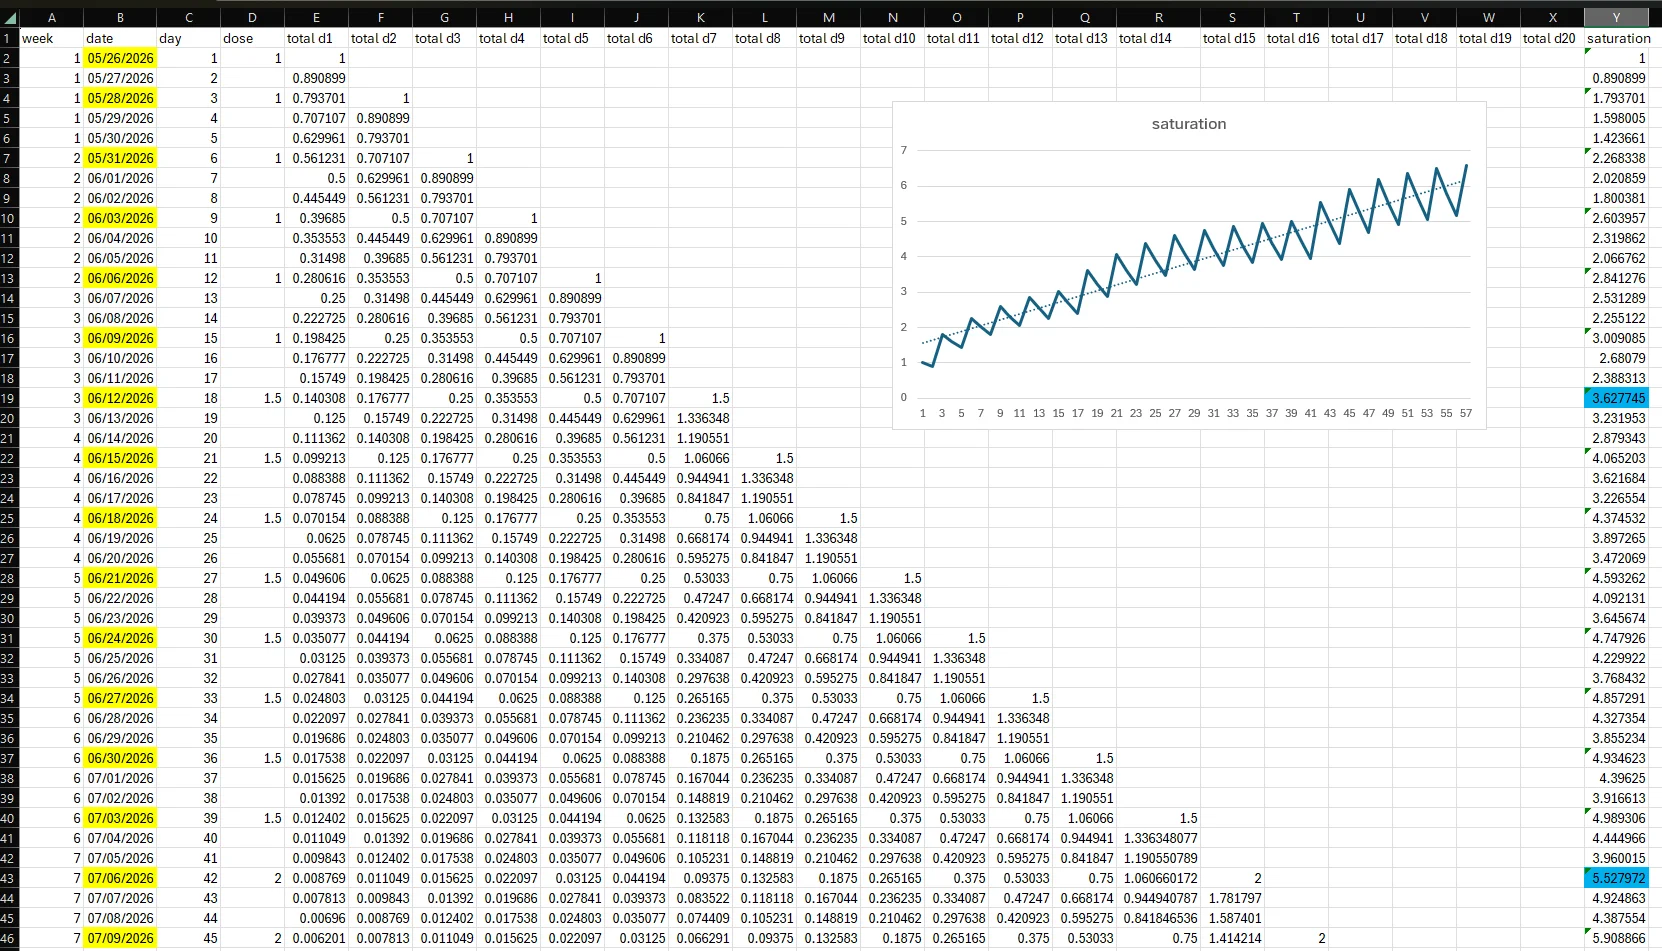
Next I laid out a day by day schedule of my own doses.

I settled on dosing every 3 days, roughly mirroring the trial's 2mg starting dose. So week 1 is 1mg on day 1, then 1mg again 3 days later, giving 2mg across 6 days. Not a clean 2mg per week, slightly above that because I'm counting 6 days.

45 days on my modified plan:
cab184a545bb854314329947fa4b7fad8289584156582f4f038781b73c9e7452.webp


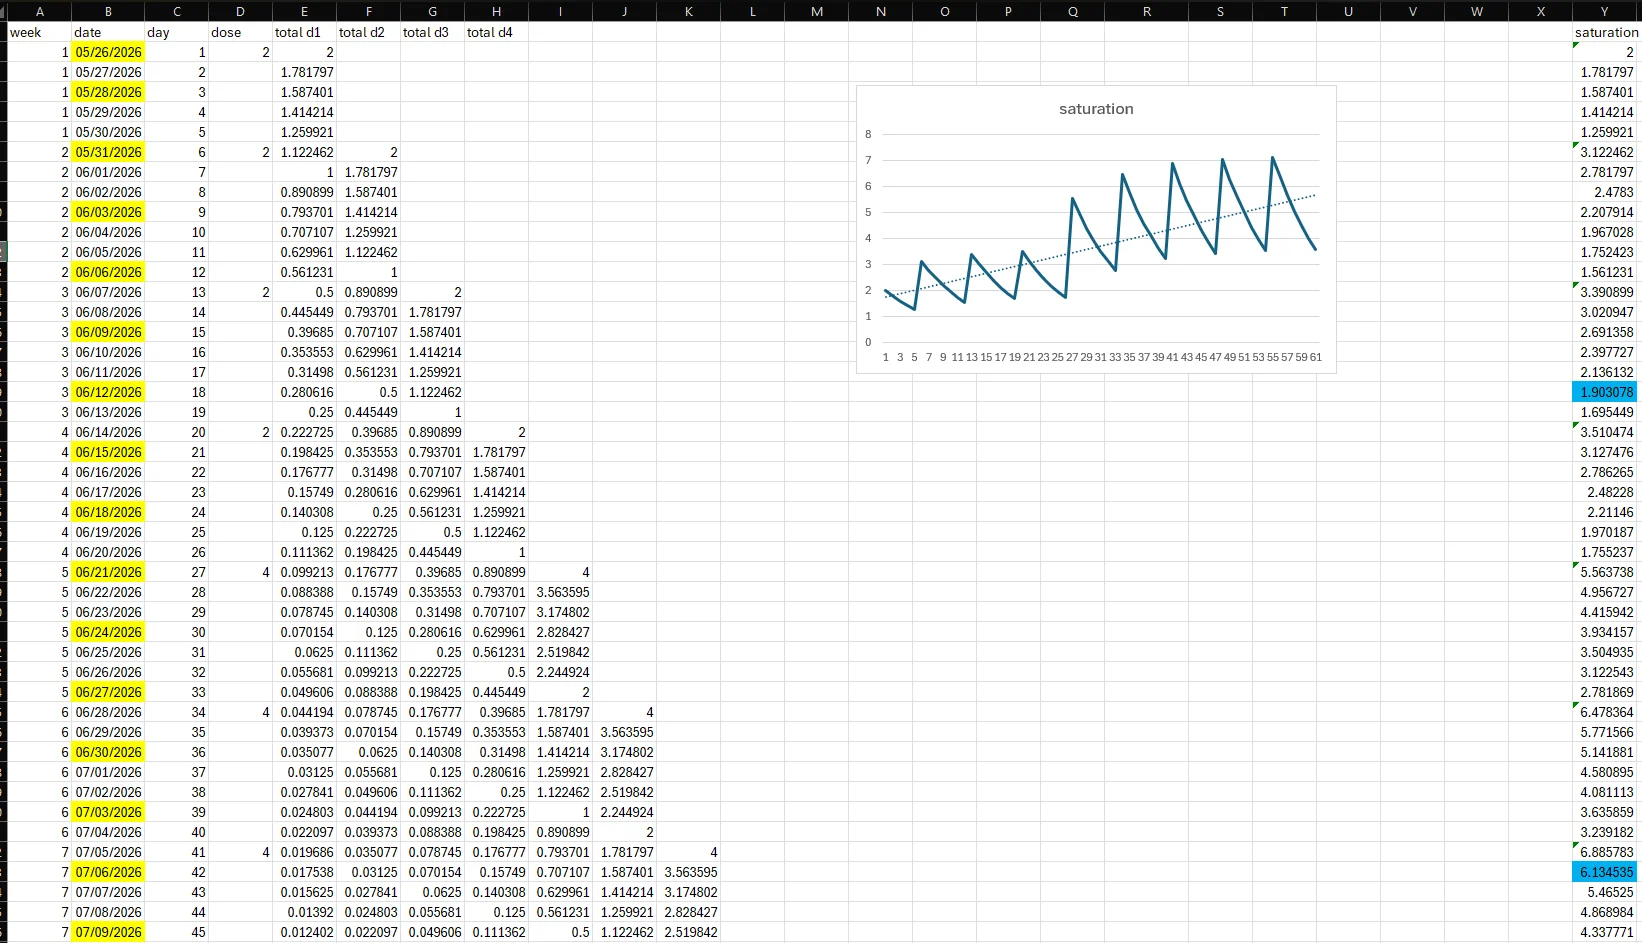
and the same 45 days on the trial (2mg start) plan
5d3b1b6d7cbec4bae124608a5bb147bc73e08eea4ce4847e52049676733d39cb.webp


Each got a graph so the peaks and troughs are visible. The q3d line is clearly smoother. The bigger point: the peaks and troughs (last column on the right) hold much steadier when dosing is more frequent.

Despite the faster 6 day vs 7 day timeline, saturation values sit fairly close by day 45. Trial numbers top out at 6.88 during that final week and bottom at 3.24 (a 3.64 spread) inside the same week. The 6 day plan tops out at just 5.91, while its nearest trough is 3.96 (a 1.95 spread)

Posting this in case anyone else wants to nerd out.
 
No disrespect intended, but that's far too much effort. I simply take 8mg every Friday.
 
Am I right in thinking this is about reta? For me, taking smaller amounts more often has worked really well to keep side effects in check while still letting me reach a higher weekly total than I could otherwise tolerate. In my case, both reta and tirz are capped by skin sensory issues: even a slight bump from either 4.5mg tirz or 1.4mg reta every 2 days aggravates it.

With any titration plan, the key is to adjust according to side effects or even desirable effects such as reduced appetite. If you are getting mild side effects (nausea is the one most likely to show up at a given dose), that is a fairly strong signal that a somewhat higher dose will produce the same effect but more intensely. So when side effects appear, it is generally wise to hold back on increasing the dose, particularly if you are relying on smaller, more frequent doses to move up faster than the standard pace.
 
What we're dealing with here isn't mathematics—it's biochemistry, chemistry, statistical physics (Gibbs energy), and fluid mechanics (the laws of diffusion).

Consideration must be given to the climb toward peak concentration. While Reta starts acting during this phase, it simultaneously starts breaking down (24 to 72 hours). The half-life figure that gets published represents an average, with observed swings of roughly plus or minus 1 day (from what I've seen, the typical average lands somewhere around 5.7-5.8 days).

Three receptors exist, each with differing affinities, and in certain cases genetic variants can cut affinity by a factor of 160.

On albumin, Reta lingers for an extended period—this is what accounts for its half-life. That's yet another reservoir producing person-to-person differences.

The actual picture is far more intricate and refuses to collapse into one single figure.

Better to trust the biological signals you can observe. Side effects, hunger, fasting blood sugar, and postprandial blood sugar...

Also, please figure out how to use the button for showing two significant figures: your table can't be read as it is.
 
lessthanhalf said:

Am I right in thinking this is about reta? For me, taking smaller amounts more often has worked really well to keep side effects in check while still letting me reach a higher weekly total than I could otherwise tolerate. In my case, both reta and tirz are capped by skin sensory issues: even a slight bump from either 4.5mg tirz or 1.4mg reta every 2 days aggravates it.

With any titration plan, the key is to adjust according to side effects or even desirable effects such as reduced appetite. If you are getting mild side effects (nausea is the one most likely to show up at a given dose), that is a fairly strong signal that a somewhat higher dose will produce the same effect but more intensely. So when side effects appear, it is generally wise to hold back on increasing the dose, particularly if you are relying on smaller, more frequent doses to move up faster than the standard pace.
right, reta — that crucial piece of info was totally missing from my end, ha.

eidos said:

What we're dealing with here isn't mathematics—it's biochemistry, chemistry, statistical physics (Gibbs energy), and fluid mechanics (the laws of diffusion).

Consideration must be given to the climb toward peak concentration. While Reta starts acting during this phase, it simultaneously starts breaking down (24 to 72 hours). The half-life figure that gets published represents an average, with observed swings of roughly plus or minus 1 day (from what I've seen, the typical average lands somewhere around 5.7-5.8 days).

Three receptors exist, each with differing affinities, and in certain cases genetic variants can cut affinity by a factor of 160.

On albumin, Reta lingers for an extended period—this is what accounts for its half-life. That's yet another reservoir producing person-to-person differences.

The actual picture is far more intricate and refuses to collapse into one single figure.

Better to trust the biological signals you can observe. Side effects, hunger, fasting blood sugar, and postprandial blood sugar...

Also, please figure out how to use the button for showing two significant figures: your table can't be read as it is.
Solid observations regarding breakdown and the broader theoretical side. Everything depends on each individual's metabolism and will differ a lot between people.

eidos said:

What we're dealing with here isn't mathematics—it's biochemistry, chemistry, statistical physics (Gibbs energy), and fluid mechanics (the laws of diffusion).

Consideration must be given to the climb toward peak concentration. While Reta starts acting during this phase, it simultaneously starts breaking down (24 to 72 hours). The half-life figure that gets published represents an average, with observed swings of roughly plus or minus 1 day (from what I've seen, the typical average lands somewhere around 5.7-5.8 days).

Three receptors exist, each with differing affinities, and in certain cases genetic variants can cut affinity by a factor of 160.

On albumin, Reta lingers for an extended period—this is what accounts for its half-life. That's yet another reservoir producing person-to-person differences.

The actual picture is far more intricate and refuses to collapse into one single figure.

Better to trust the biological signals you can observe. Side effects, hunger, fasting blood sugar, and postprandial blood sugar...

Also, please figure out how to use the button for showing two significant figures: your table can't be read as it is.
If you tap the images they ought to open up, so you can zoom in when necessary. At least that works for me on both desktop and tablet.
 
390120 said:

just use https://glp1plotter.com/ instead

For months I stuck to a 6-day interval and it worked well; when I tried a 3-day interval for two weeks, I felt too nauseous
I spent roughly 2 days searching for exactly this. Yeah, it matches what I was trying to achieve. Since I couldn't locate it, I built my own version.

Adjusting and checking concentrations is far simpler this way as well.

This is precisely the goal I had in mind:

b7b8301793369c811801764a53a1941dffeee22c970dc0ca04c488b0d4b94a70.webp


e30423c467831b96bed86bde2a2dca3c78bab5eac35c42a7aeb12fcb9ea6cf39.webp


the initial 4 weeks increase to around 3mg concentration, the following 4 top out at 4, then the next 4 weeks reach a peak of 5. With the 3 day protocol, the troughs stay only about 1gm below the peaks.
 
That has me thinking too. Split dosing is something I use for side effect control, yet our physiology runs on cycles, so maybe the ups and downs of weekly serum levels suit glp's better. Could the trough at the tail of each week act as a reset, giving the body a pause instead of a steady "lose lose lose" signal, before the next shot arrives? It frustrates me that clinical trials are shaped by money and marketable numbers as much as by science and patient care. A trial could actually put this question to the test...
 
deleted.user.26 said:

That has me thinking too. Split dosing is something I use for side effect control, yet our physiology runs on cycles, so maybe the ups and downs of weekly serum levels suit glp's better. Could the trough at the tail of each week act as a reset, giving the body a pause instead of a steady "lose lose lose" signal, before the next shot arrives? It frustrates me that clinical trials are shaped by money and marketable numbers as much as by science and patient care. A trial could actually put this question to the test...
Natural GLP-1 and the other peptides circulate at far lower concentrations (nmol/l) compared with what GLP therapy drugs achieve (micromol/l), and they persist only minutes in the blood. Consequently, even at the trough between doses, concentrations remain orders of magnitude above the naturally occurring versions. So I do not think there is any significant reset process happening during dips in levels. Not every drug behaves this way, but evidence for tolerance to glp drugs is really minimal, aside from nausea, vomiting and gastric emptying during the first few months.

For most people, weekly dosing is straightforward, convenient and adequate. Split dosing primarily serves to help manage side effects, or it can be used to escalate doses a bit faster with lower risks.
 
Back
Top