

nkresho
Explorer
Spent some time in excel today, thought the group might get something out of it.
I've been digging into half-life a little and putting the trial dosing timeline side by side with a tighter interval (the one I'm on).
Results below.
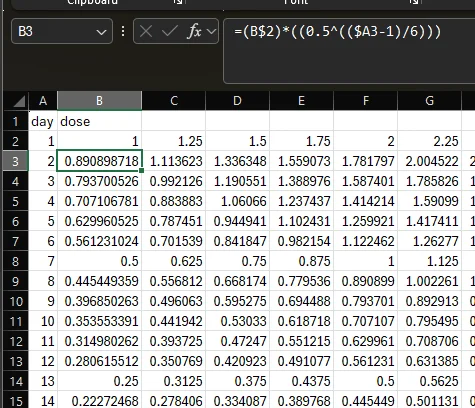
Step one was building an excel formula for the 6 day half life decay.
saturation from the previous day times 0.5 raised to (days elapsed / 6)
With that, day 6 lands at half, day 12 at a quarter, and it keeps halving from there...
Next I laid out a day by day schedule of my own doses.
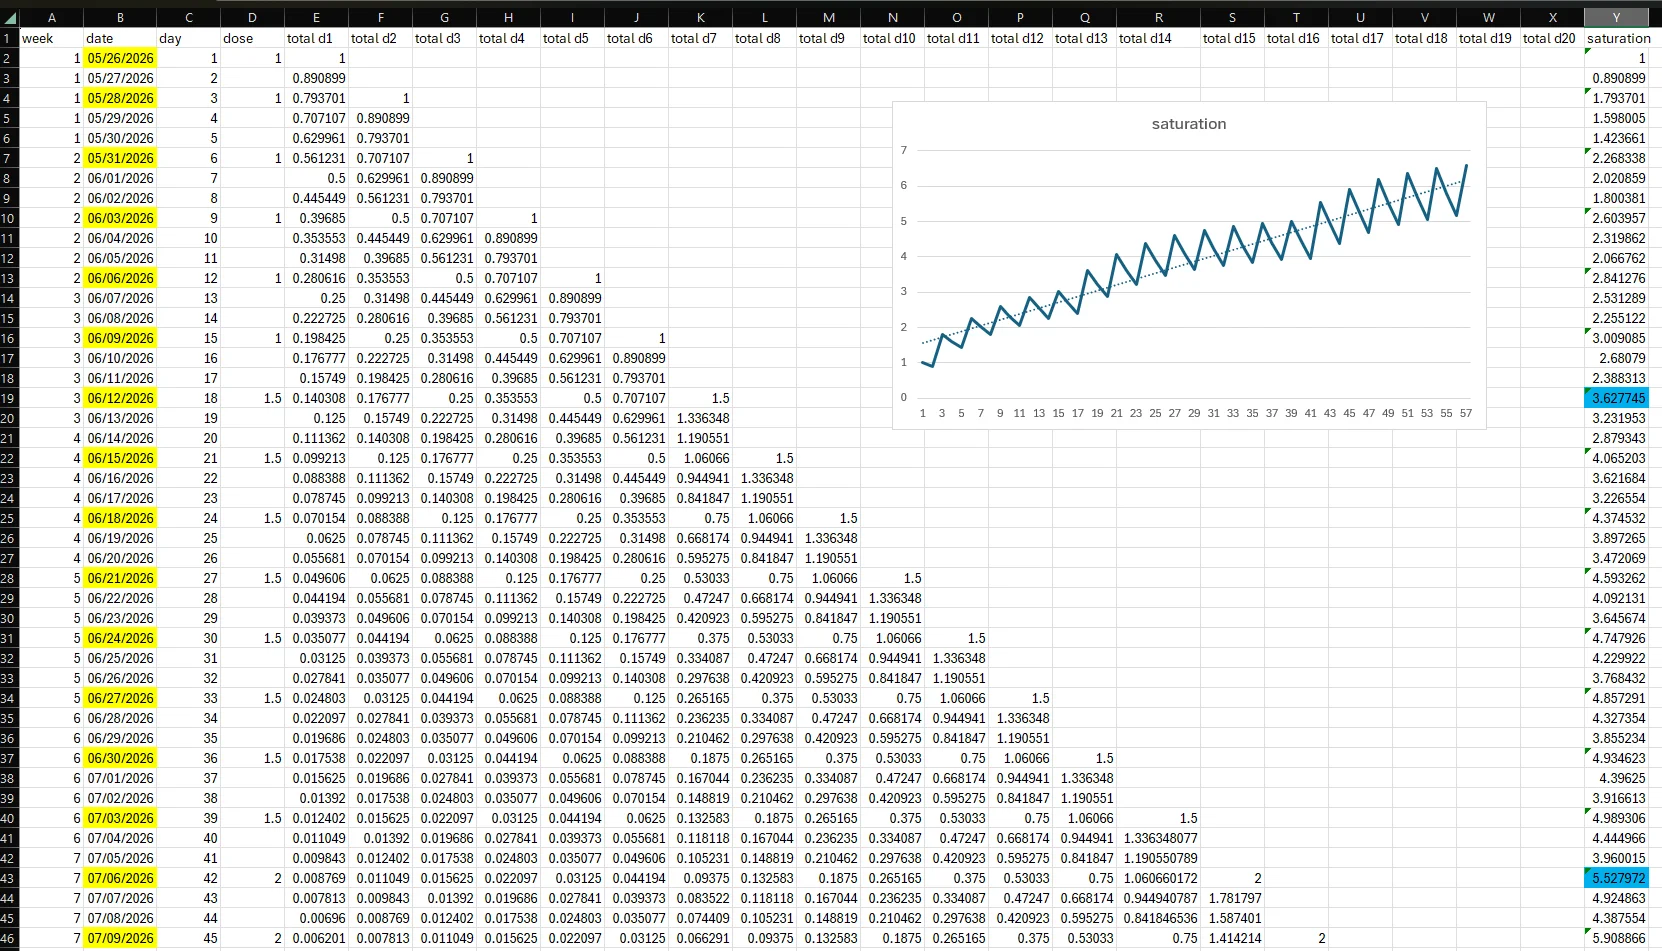
I settled on dosing every 3 days, roughly mirroring the trial's 2mg starting dose. So week 1 is 1mg on day 1, then 1mg again 3 days later, giving 2mg across 6 days. Not a clean 2mg per week, slightly above that because I'm counting 6 days.
45 days on my modified plan:
and the same 45 days on the trial (2mg start) plan
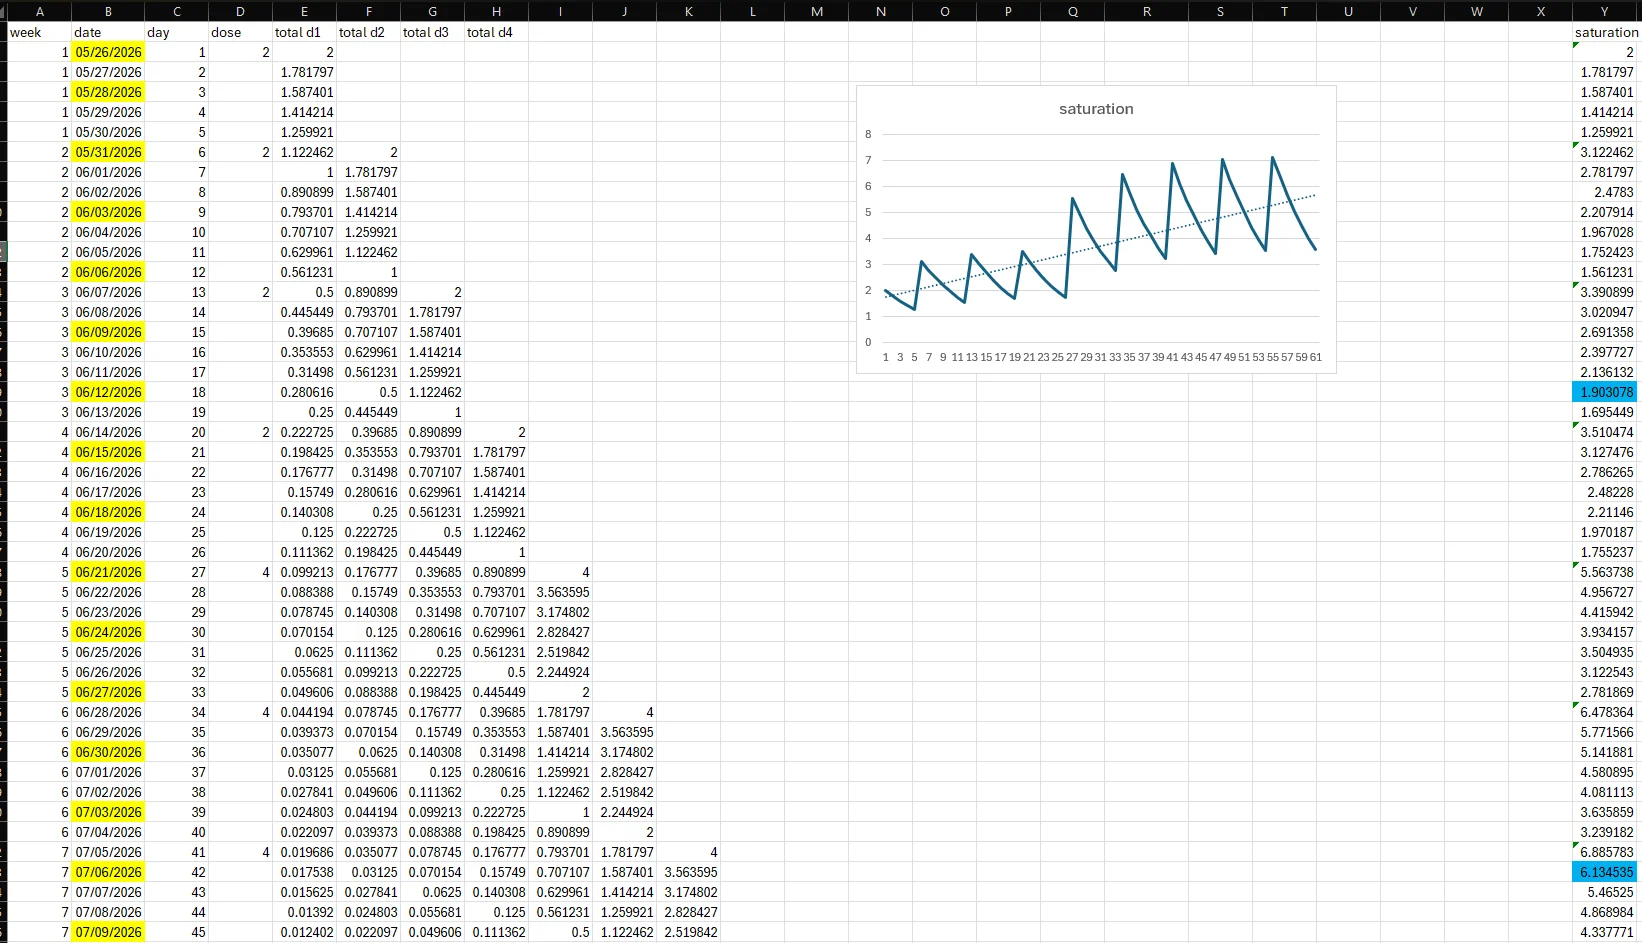
Each got a graph so the peaks and troughs are visible. The q3d line is clearly smoother. The bigger point: the peaks and troughs (last column on the right) hold much steadier when dosing is more frequent.
Despite the faster 6 day vs 7 day timeline, saturation values sit fairly close by day 45. Trial numbers top out at 6.88 during that final week and bottom at 3.24 (a 3.64 spread) inside the same week. The 6 day plan tops out at just 5.91, while its nearest trough is 3.96 (a 1.95 spread)
Posting this in case anyone else wants to nerd out.
I've been digging into half-life a little and putting the trial dosing timeline side by side with a tighter interval (the one I'm on).
Results below.
Step one was building an excel formula for the 6 day half life decay.
saturation from the previous day times 0.5 raised to (days elapsed / 6)
With that, day 6 lands at half, day 12 at a quarter, and it keeps halving from there...
Next I laid out a day by day schedule of my own doses.
I settled on dosing every 3 days, roughly mirroring the trial's 2mg starting dose. So week 1 is 1mg on day 1, then 1mg again 3 days later, giving 2mg across 6 days. Not a clean 2mg per week, slightly above that because I'm counting 6 days.
45 days on my modified plan:
and the same 45 days on the trial (2mg start) plan
Each got a graph so the peaks and troughs are visible. The q3d line is clearly smoother. The bigger point: the peaks and troughs (last column on the right) hold much steadier when dosing is more frequent.
Despite the faster 6 day vs 7 day timeline, saturation values sit fairly close by day 45. Trial numbers top out at 6.88 during that final week and bottom at 3.24 (a 3.64 spread) inside the same week. The 6 day plan tops out at just 5.91, while its nearest trough is 3.96 (a 1.95 spread)
Posting this in case anyone else wants to nerd out.


